Why Synthetic Panel Scores Differ from Real Consumer Purchase Intent

Concept Studio ranked 69 food ideas in a similar order to real consumers, but category scores spread wider. Eating experience data helps explain the gap.
Can an AI-Written Concept Go to the Review Meeting?

The Data Behind Concept Studio: Opensurvey's Food Diary

How to Interpret Concept Screening Results: Averages, Segments, and Evaluation Reasons

How Closely Do Synthetic Panels Match Real Consumers?
Why Synthetic Panel Scores Differ from Real Consumer Purchase Intent
‹
›
When you evaluate a set of new product ideas in Concept Studio, the ideas with high purchase intent stand out first. That leaves you wondering whether the lower-scoring ideas simply lack appeal. The call gets even harder when you compare ideas across different product categories. Can a gap in scores be read as a gap in the appeal of the ideas themselves?
To answer that, we first need to look at what Concept Studio's purchase intent actually shows. Comparing it with the purchase intent measured in familiar consumer research helps clarify its nature. Drawing on two sets of results for the same food ideas, we look at how the scores differ and what to consider when interpreting that difference.
Similar rankings, different positive rates
To check how closely Concept Studio's predictions match real consumers' purchase intent, Opensurvey compared consumer research and synthetic panel evaluations of the same food ideas. For each idea, we calculated the share of responses that rated purchase intent positively, which we call the "positive rate," and ranked the ideas from highest to lowest. The ideas at the top and bottom were largely similar across the two evaluations, but the positive rate for each idea was not the same.
Rankings show each idea's position relative to the others being compared. So even when the same idea ranks near the top in both the real consumer and Concept Studio evaluations, the share of positive responses can differ.
In fact, comparing the two evaluations showed that the average positive rate across all ideas was lower in the synthetic panel. That does not mean the synthetic panel rated every category lower. Some categories scored higher than in the real consumer research, and the gaps between categories were also wider in the synthetic panel.
The two evaluations ranked ideas similarly from high to low, but differed in the level of positive rates and in the gaps between categories. To understand why, we need to look at how the responses are produced. Both evaluations are about purchase, but who answers and what information informs the judgment are different.
In Concept Studio, an AI researcher predicts purchase response
In real consumer research, respondents are shown a product idea and asked, "If this were actually sold, how much would you want to buy it?" They answer directly, drawing on their own experiences and thoughts. Their purchase intent can also reflect a general liking for the product or a wish to try it once.
In Concept Studio, however, the response is generated by an AI researcher. For food, Concept Studio builds a persona describing each consumer's characteristics from the profile, dietary attitudes, and eating records of an Opensurvey Food Diary participant. The AI researcher reads this persona together with the product idea and judges, "Would a person like this buy this product?" Unlike research that hears consumers' own intent directly, this approach predicts purchase response from a third-party perspective, based on real consumer data.
Say you are evaluating a new beverage idea. The AI researcher connects the beverage preferences and drinking experiences captured in the persona with the product's features. It then judges whether the product is one this person would plausibly buy, given their existing tastes and consumption habits.
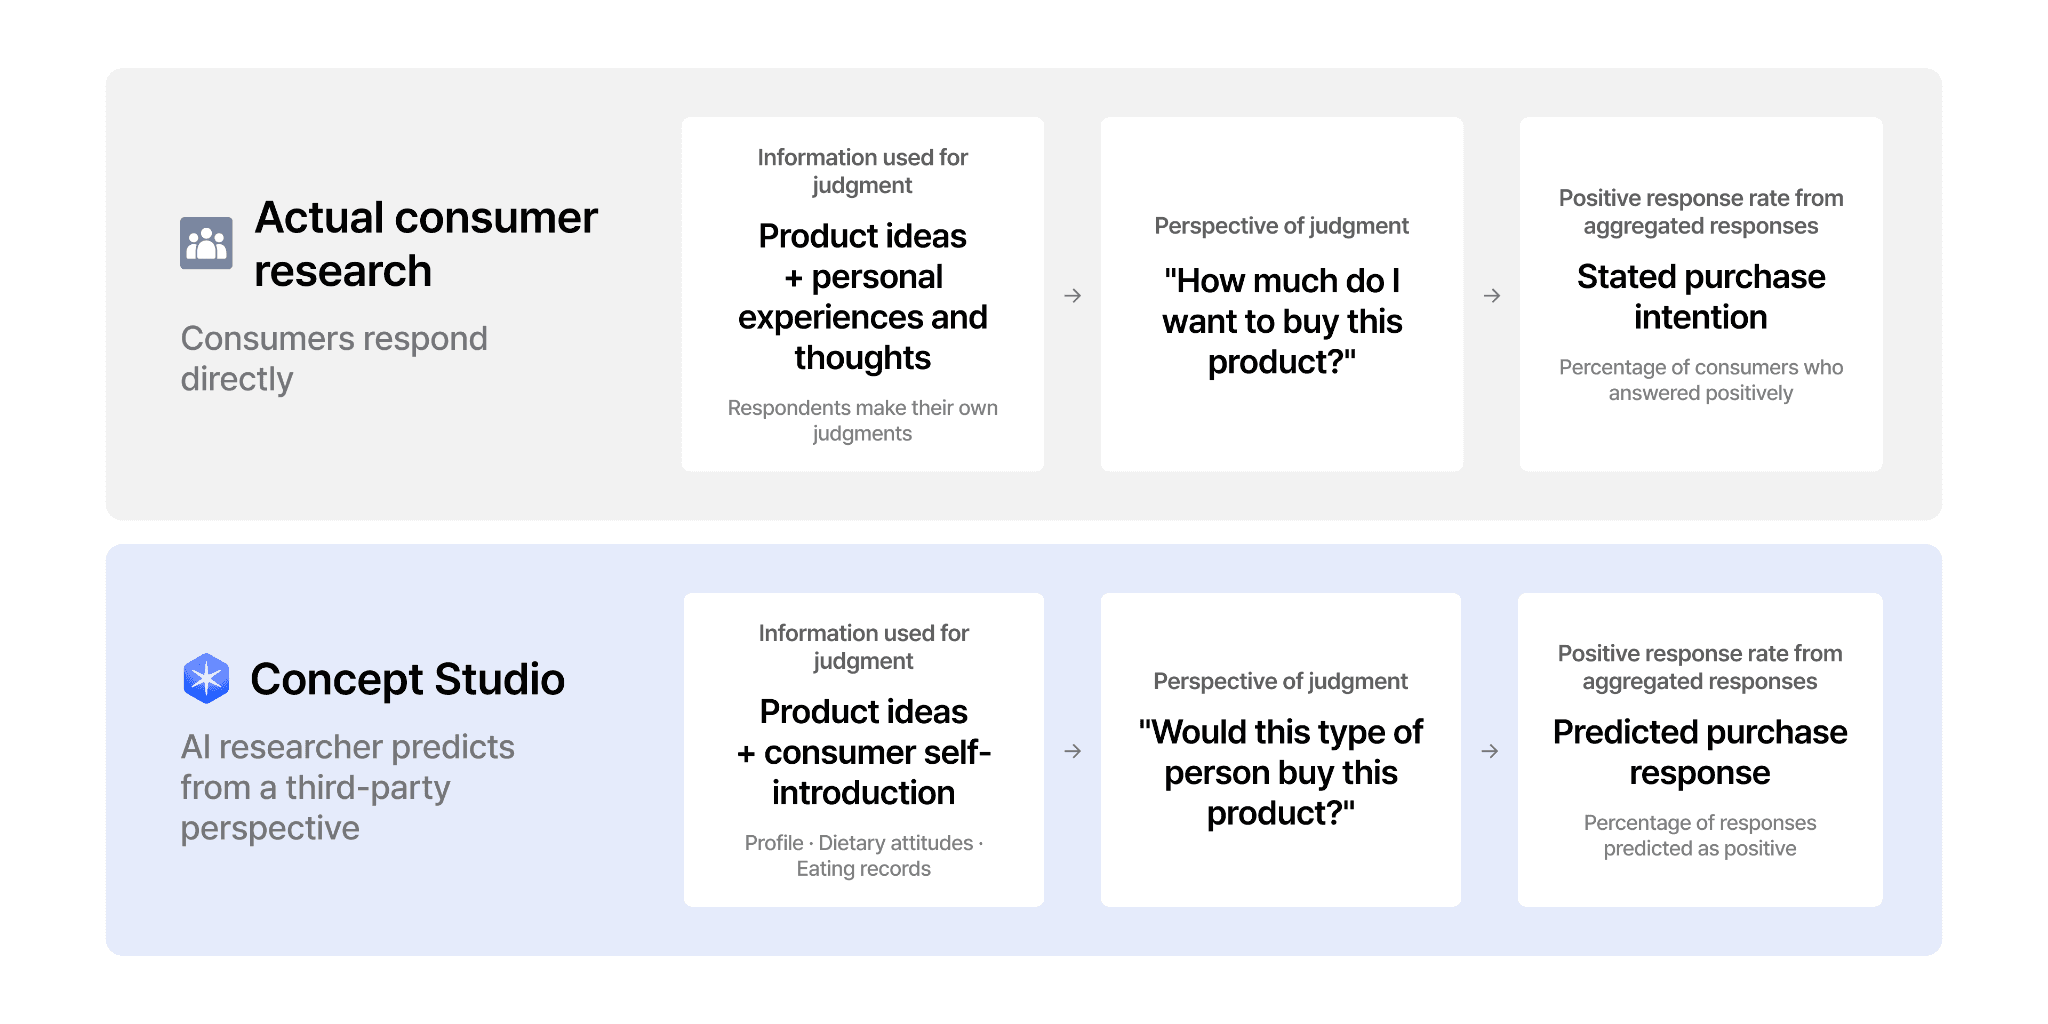
[Figure] In real consumer research, consumers state their purchase intent directly based on their own experiences and thoughts. In Concept Studio, an AI researcher predicts purchase response based on a synthetic consumer persona and the product idea. For food, personas are built from the profiles, dietary attitudes, and eating records of Opensurvey Food Diary participants. Positive rates are calculated by aggregating the positive responses in each evaluation.
So how did the gap in positive rates between real consumer research and Concept Studio play out across product categories?
How category gaps relate to actual eating experience
To see whether the gap in the overall average ran in the same direction within each category, we compared the average positive rate by category for the same 69 food ideas in both evaluations. In the real consumer research, category averages ranged from 39.8% to 52.0%. In the synthetic panel, they spread much wider, from 21.4% to 65.8%. Unlike the overall average, the synthetic panel's positive rates were higher than the real consumer research for bunsik and noodles (bunsik refers to casual Korean snack foods such as tteokbokki and gimbap) and for Korean dishes, and lower for beverages and dairy.
Why were the gaps between categories wider in the synthetic panel? Because the AI researcher draws on consumers' dietary information in its evaluations, we hypothesized that the kinds of food people usually eat might be related to this gap, and examined the eating records in Opensurvey Food Diary.
Using data collected from June 2025 to May 2026, we checked whether each participant had eaten each type of food at least once over a 7-day period, based on the menu items corresponding to the evaluated ideas. We call the share of people who ate it at least once "consumption penetration." We then compared consumption penetration by category with the synthetic panel's positive rates to see whether consumption experience and evaluation levels followed a similar pattern.
Consumption penetration was high for Korean dishes at 72.2% and for bunsik and noodles at 60.5%. By contrast, it was 8.0% for dairy and 11.7% for cereals and bars. The categories where the synthetic panel's positive rates were high, Korean dishes and bunsik and noodles, also had a high share of people who had eaten them. The categories where positive rates were low, dairy and cereals and bars, had a low share.

[Figure] Purchase intent positive rates from real consumers and the synthetic panel, compared with Opensurvey Food Diary consumption penetration, by category. Positive rates are category averages for 69 unbranded food ideas, evaluated by 400 real consumers per concept and 240 synthetic panel members. Consumption penetration is the share of people who ate a menu item corresponding to the evaluated ideas at least once over 7 days, based on records from 2,880 participants selected by equal quota allocation from June 2025 to May 2026 data. The figure compares category-level patterns across different metrics.
The finding that the synthetic panel's overall average was lower should also be read alongside these category differences. For Korean dishes and bunsik and noodles, the positive rate was higher than in the real consumer research. For beverages and dairy, it was lower. The average gap alone, then, does not support the conclusion that the synthetic panel rates every idea uniformly lower. The direction and size of the gap depended on which category the idea belonged to.
To understand why eating experience and positive rates rose and fell together, it helps to consider the information captured in each persona. If few experiences of eating or drinking a type of product are recorded, the persona may not contain enough preferences or experiences related to that product. In that case, the AI researcher may struggle to find grounds for a positive purchase prediction and lean toward a neutral judgment.
For example, a record showing that someone regularly enjoys coffee gives grounds for judging their response to a new coffee product. But if nothing reveals their tastes or experiences with aloe drinks, there may not be enough information to judge. And if the persona shows that they avoid caffeine, that becomes grounds for predicting they would not buy the coffee. The fact that the available information, and what it says, varies by product offers another clue for interpreting the link between eating experience and positive rates.

[Figure] An illustrative example of predicting purchase response to two products based on the beverage preferences and drinking experiences of six hypothetical consumers. Experience that fits the product supports a positive judgment, an avoidance tendency supports a negative judgment, and a lack of relevant information can lead to a neutral judgment. The people, records, judgments, and positive rates are illustrative only and are not results from actual research or synthetic panel evaluations.
Concept Studio brings consumer experience into early idea evaluation
Marketing research has long interpreted purchase intent alongside consumers' experience and purchase conditions. In studies where purchase intent matters most, such as concept tests and demand forecasting, researchers also examine category purchase experience and frequency, the need for the product, and price perception, depending on the study's purpose. The aim is to go a step beyond "I'd like to try it" and understand whether consumers have both a reason and the circumstances to buy the product in their everyday lives.
Concept Studio's purchase intent is generated differently from intent stated by consumers themselves. An AI researcher predicts responses based on consumers' tastes and experiences, and the information available can vary by category. Gaps in positive rates relative to real consumer research should be read with the nature of this evaluation in mind.
Comparing the results with category-level eating experience offered clues to understanding those gaps. By bringing consumption experience into the earliest evaluation of ideas, Concept Studio lets teams examine not just the idea itself but how a product fits into consumers' everyday lives.
Synthetic Consumer
AI


Opensurvey
Opensurvey is an AI research tech company. We connect the entire research process—from research planning to data collection and analysis—with AI, and we offer a platform, expert research services, and a consumer panel all together. We work alongside industry-leading companies such as Samsung Electronics, P&G, CJ CheilJedang, and Woowa Brothers, and over the past 14 years we have served some 3,000 corporate clients across 25,000 projects. With ISMS-P, ISO/IEC 27001·27701, and ISO 20252 certifications, along with full membership in ESOMAR, we meet international standards in both security and research quality.
Dataspace
Dataspace is an AI-powered consumer intelligence platform provided by Opensurvey. An orchestrator that understands research context, together with specialized agents for each stage, accompanies the entire research process—from planning to data collection, analysis, insight reporting, and sharing. Its Dual Layer architecture, which separates statistical computation from AI inference, ensures analytical accuracy, and every insight is presented with evidence grounded in real consumer responses. You can connect with consumer panels in 20 countries including Korea, collect data directly from your own customers, or use APIs to integrate with external platforms such as CRM systems. The consumer data and research context accumulated in Dataspace remain as a company's intelligence asset. Building on this, you can create synthetic consumers tailored to your own brand to hold conversations with them and predict market responses.
ⓒ Opensurvey
All copyrights to Opensurvey's content belong to Opensurvey Inc. When citing, you must always indicate the source; even with attribution, copying content in full, unauthorized reproduction, and redistribution are prohibited. When citing the source, please include the name of the Opensurvey blog and the URL or link of the article cited. ex) Opensurvey Blog, article URL or link