
Concept Studio’s synthetic panel ranked 69 F&B ideas in the same order as real consumers for 89.1% of significantly different pairs, 94.2% within category.

Can an AI-Written Concept Go to the Review Meeting?

The Data Behind Concept Studio: Opensurvey's Food Diary

How to Interpret Concept Screening Results: Averages, Segments, and Evaluation Reasons
How Closely Do Synthetic Panels Match Real Consumers?

Why Synthetic Panel Scores Differ from Real Consumer Purchase Intent
‹
›
To use synthetic panel results in real decisions, you need to know what data was validated, against what criteria, and which judgments the results can support. A similarity figure against real consumer research becomes usable evidence only when you read it in that context.
Concept Studio validated its evaluation performance for one purpose: comparing ideas and shortlisting candidates for follow-up research. We compared real consumer research and synthetic panel evaluations of the same ideas, and checked whether both ranked the higher-scoring and lower-scoring idea in each pair the same way. Among idea pairs that showed a significant difference at the 99% confidence level in real consumer research, the evaluation order matched in 89.1% of pairs across all ideas and in 94.2% of pairs within the same category.
This article explains the validation metric that measures this agreement, the replication rate: how it is defined, why we chose it, and how we designed and ran the comparison with real consumer research.
What Is the Replication Rate in Synthetic Panel Validation?
In Concept Studio’s idea evaluation validation, the replication rate is the share of idea pairs, among those with a significant difference in purchase intent in real consumer research, for which the synthetic panel ranks the two ideas in the same order. What the panel replicates is the relative order between two ideas.
To calculate it, we first pair every idea with every other idea. Idea 1 is paired with ideas 2, 3, and 4, and the remaining ideas are paired the same way. We then select the pairs whose purchase intent differed significantly in real consumer research.
For each selected pair, we compare the order in real consumer research with the order in the synthetic panel evaluation. If real consumers rated idea 1 above idea 4, the pair counts as a match when the synthetic panel also rates idea 1 higher. The replication rate is the share of selected pairs that match.
Replication rate = Number of pairs with matching order ÷ Number of selected pairs × 100
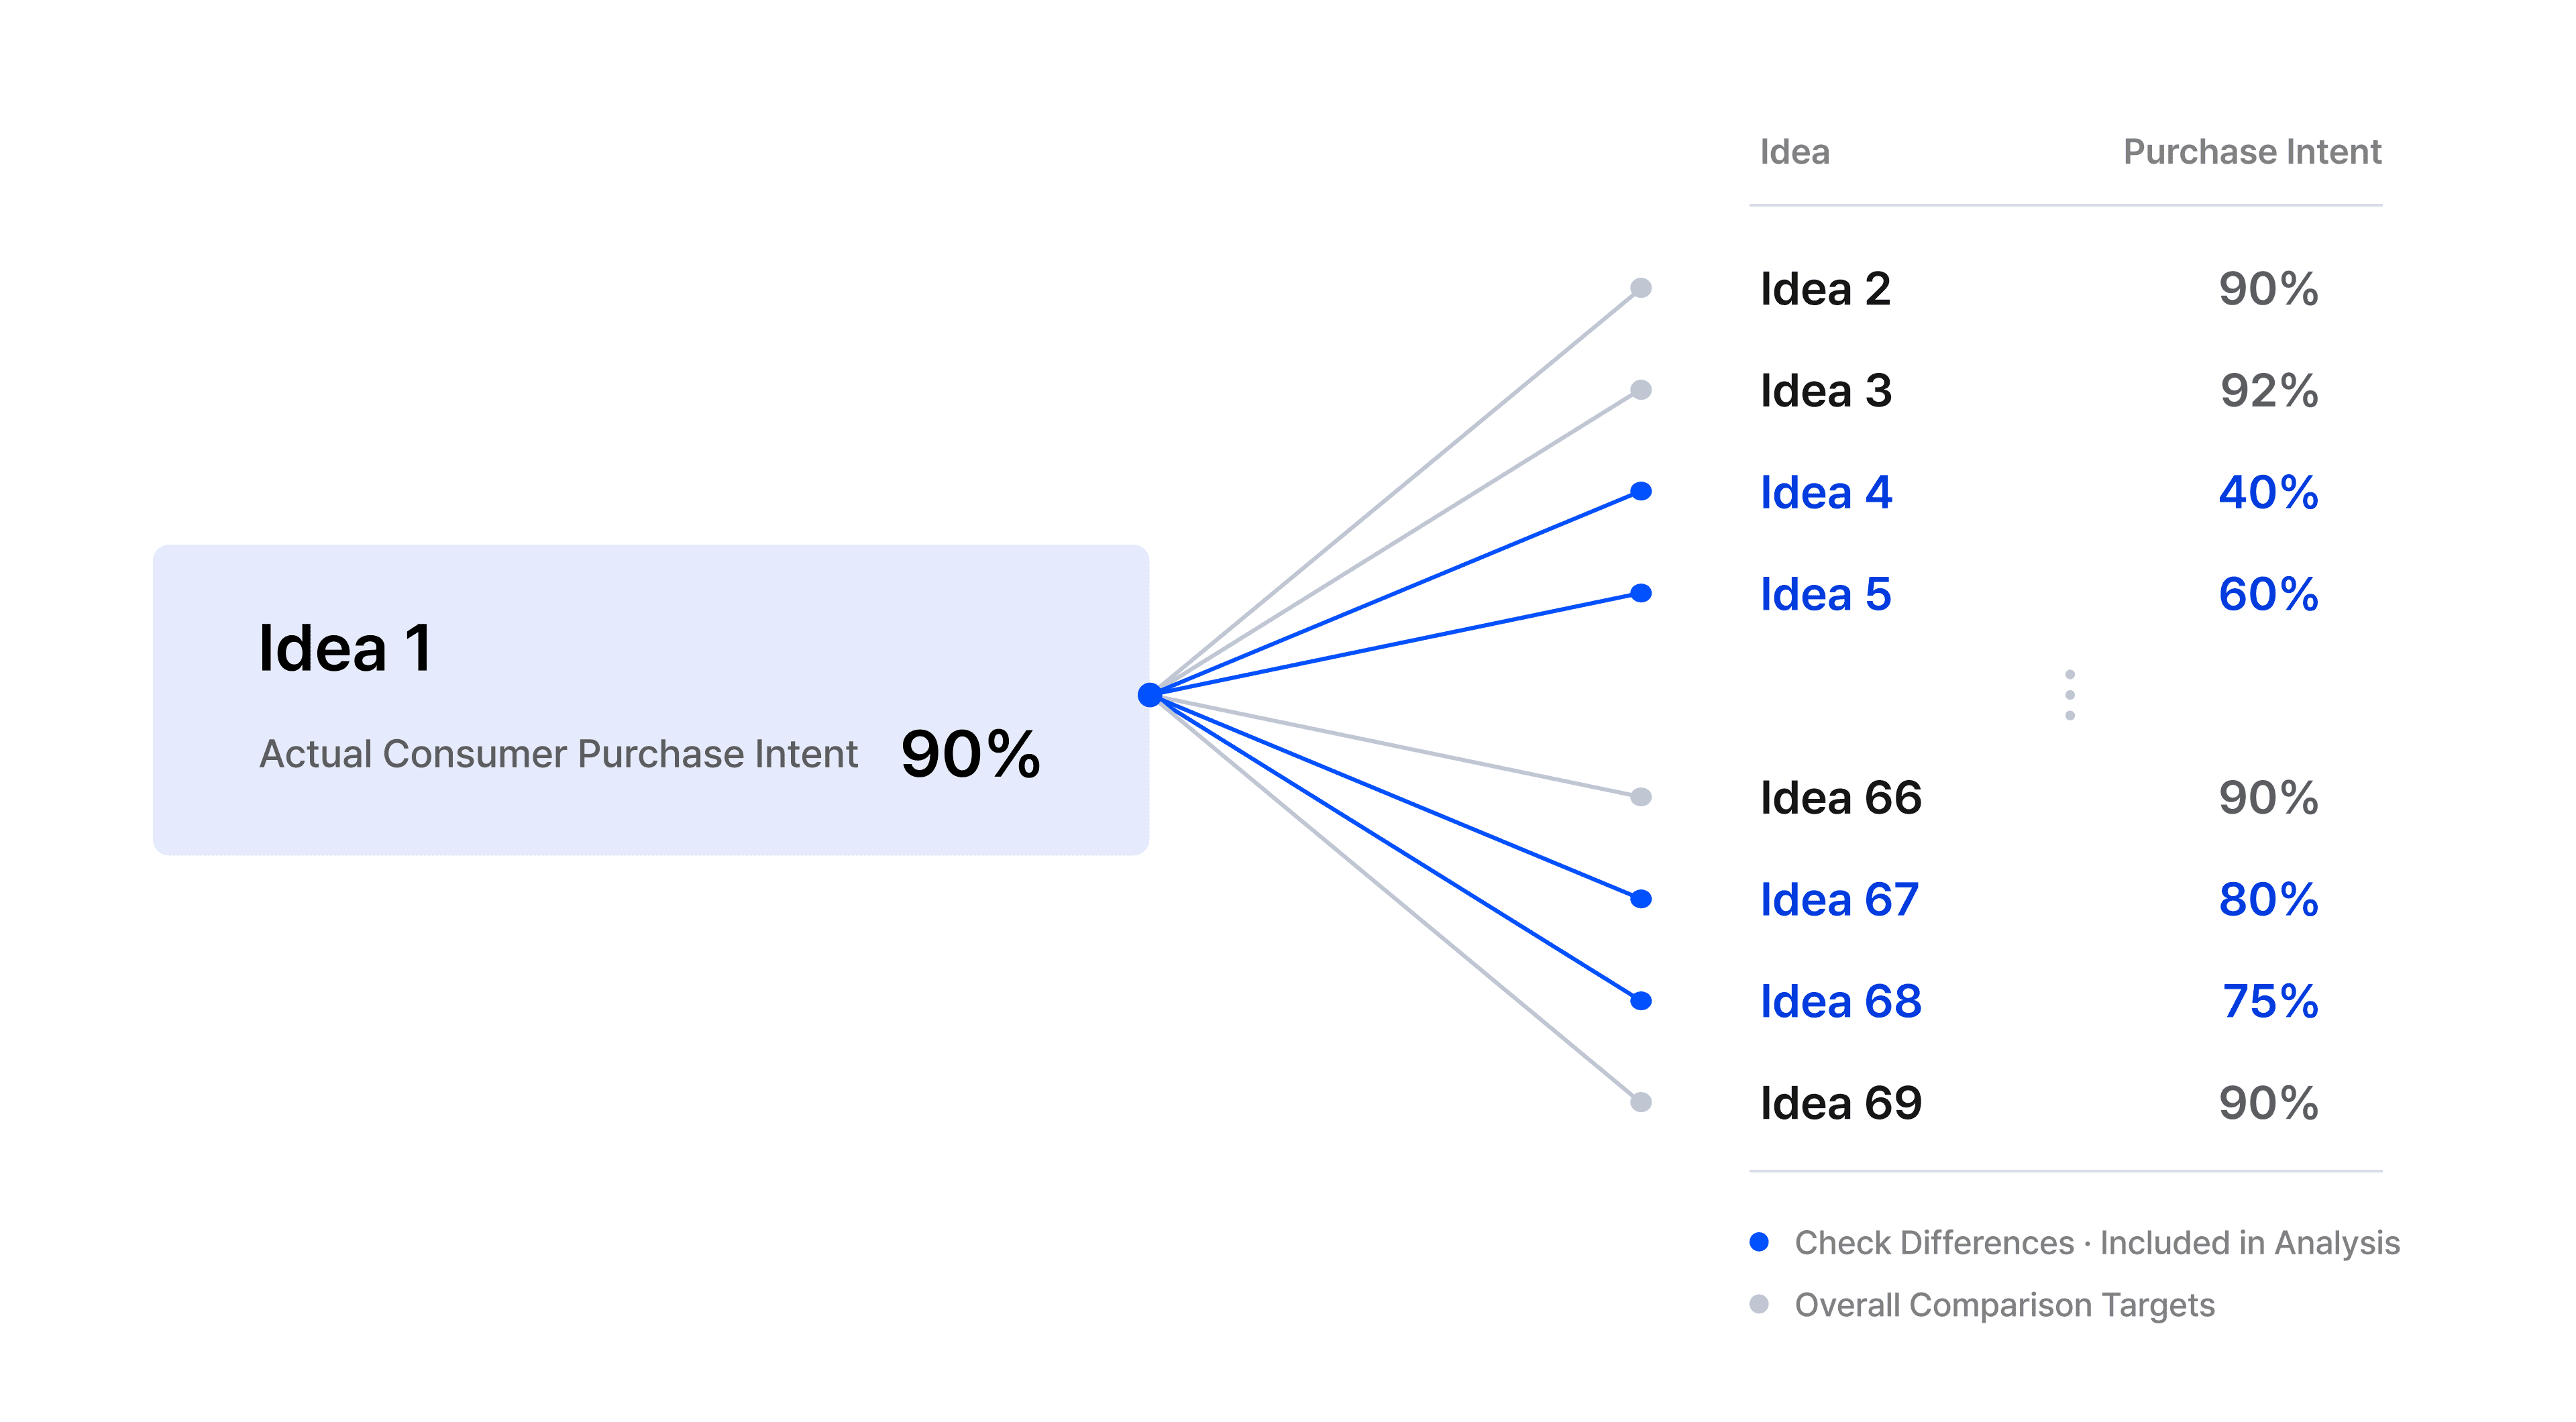
[Figure]Idea pairs with a significant difference in purchase intent in real consumer research are selected for comparison. Values are hypothetical and illustrate the selection method only.
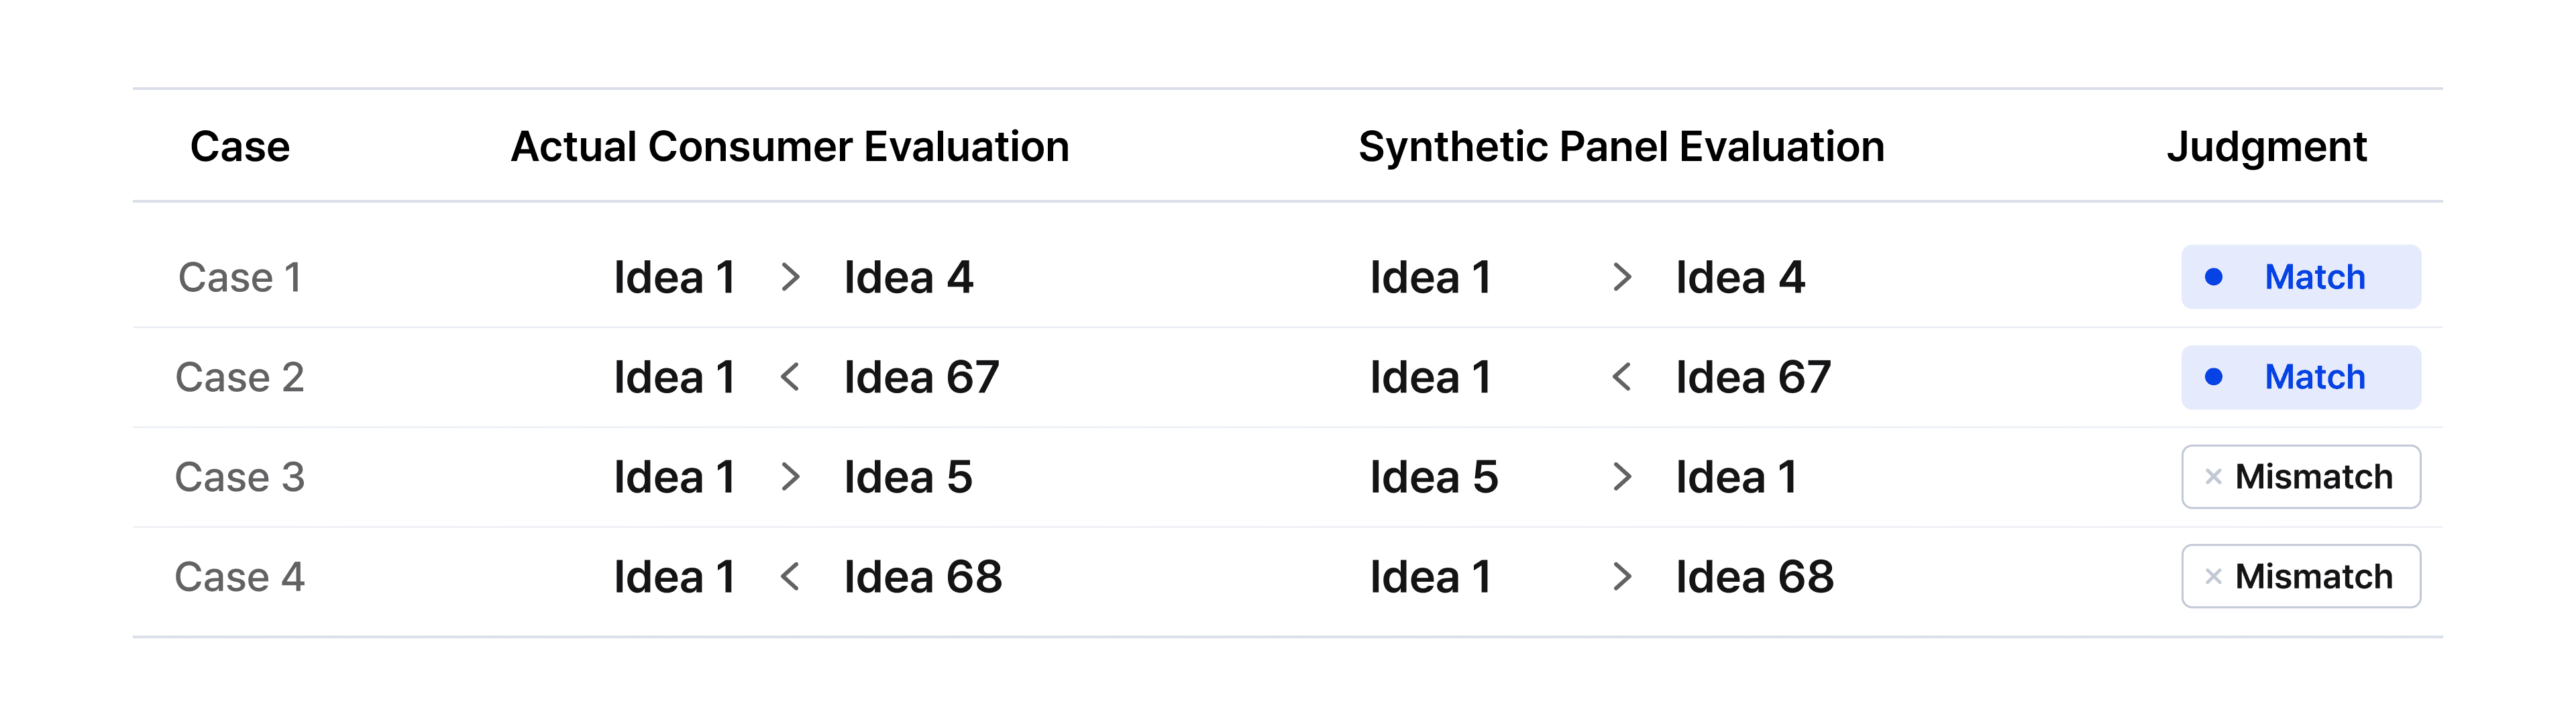
[Figure]For each selected pair, the result is a “match” if both evaluations rank the ideas in the same order and a “mismatch” if the order is reversed. The replication rate is the share of selected pairs that match.
Why Replication Rate Instead of Spearman’s Rank Correlation?
In choosing a validation metric, we looked at two things: whether it captures the differences needed to shortlist candidates, and whether the same comparison rule applies both to all ideas and to individual categories.
The replication rate covers every idea pair with a significant difference in real consumer research, so it shows clearly which candidates were compared and how many of them were ranked in the same order. The same rule applies whether we compare all ideas together or compare beverages with beverages and desserts with desserts. This lets us measure, in a consistent way, how well the panel separates candidates within each food and beverage category.
Spearman’s rank correlation is another way to check how similar two sets of results are. It also counts rank differences that can arise from sampling error, though. When real consumer research shows no clear lead between two ideas, their order alone is not enough evidence to keep or drop either one. Concept Studio therefore focused on pairs where real consumer research showed a significant lead or lag.
In idea screening, ideas that lead stay on the list for priority review, and ideas that lag are flagged for possible removal. Validation therefore needs to confirm that the synthetic panel separates leading and lagging candidates in the same direction as real consumers. For this screening purpose, we chose the replication rate, which shows how often the evaluation order matches, as Concept Studio’s primary validation metric.
Synthetic Panel vs. Real Consumer Survey: Validation Design and Results
69 F&B Ideas: 400 Real Consumers vs. 400 Synthetic Panelists
The validation covered 69 unbranded ideas across 8 food and beverage categories. The real consumer research used 400 responses per idea, and Concept Studio used predictions for a synthetic panel of 400.
The consumers who provided data to build the synthetic panel and the consumers who took part in the validation research were separate, non-overlapping samples. No respondent’s information was used for both building and validation, and the design tests whether the synthetic panel reproduces the evaluations of an independently recruited group of real consumers.
For the metric, the real consumer research measured purchase intent on a 5-point scale and counted the share of consumers who chose 5 (“Definitely want to buy”) or 4 (“Want to buy”). In Concept Studio, AI read personas containing each individual’s dietary attitudes and eating records, and predicted purchase intent as positive, neutral, or negative. We defined the share of synthetic panelists predicted as positive as “purchase likelihood,” and compared evaluation order using real consumers’ purchase intent and the synthetic panel’s purchase likelihood.
Replication Rate: 89.1% Overall, 94.2% Within Category
Comparing all ideas without separating categories, the replication rate for pairs with a significant difference at the 99% confidence level in real consumer research was 89.1%. When pairs were selected at the 90% confidence level, the replication rate was 84.6%.
We then measured how well the panel separates candidates within the same category. For pairs with a significant difference at the 99% confidence level within the same category, the pooled replication rate was 94.2%. All 8 categories had a replication rate of 80% or higher, and in 3 categories (snacks and desserts, Korean food, and bunsik and noodles) the order matched for 100% of selected pairs.
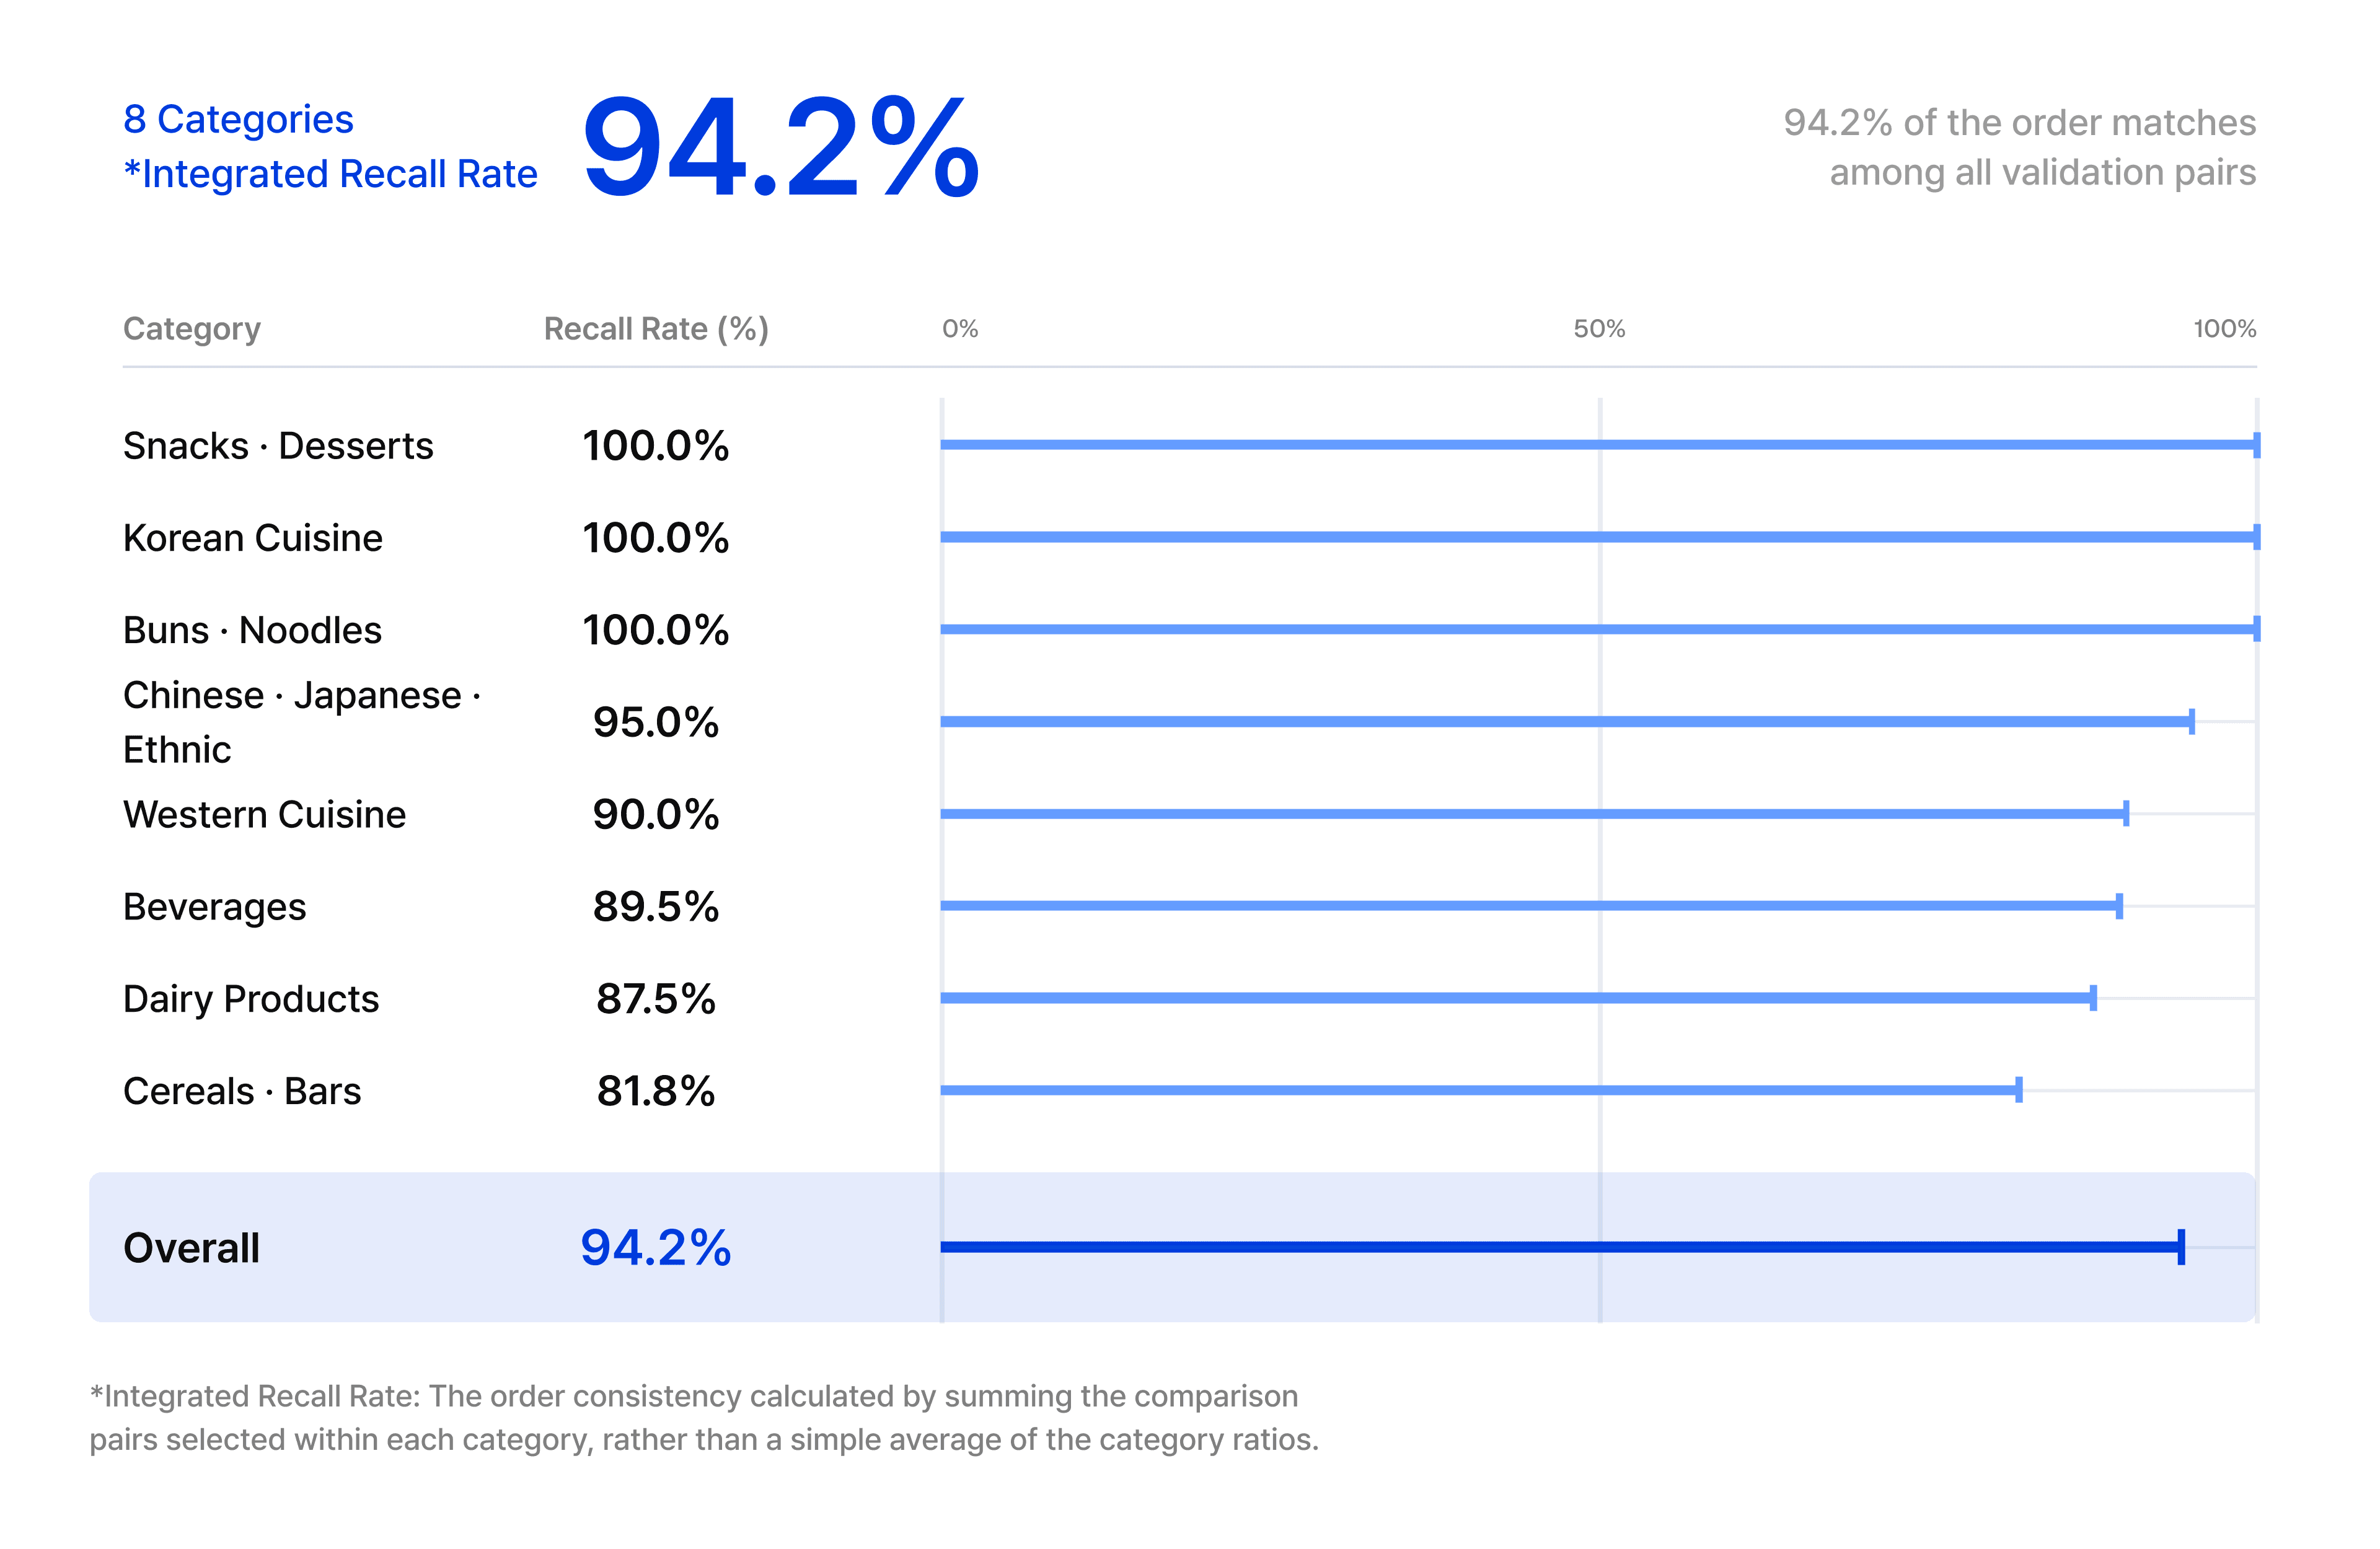
[Figure]In the all-idea comparison, pairs selected at the 99% and 90% confidence levels had replication rates of 89.1% and 84.6%. In the within-category comparison at the 99% level, all 8 categories had replication rates of 80% or higher, with a pooled rate of 94.2%.
How to Use Synthetic Panel Validation Results in Concept Screening
Concept Studio’s validation focused on the performance that idea screening requires. The replication rate supports using synthetic panel evaluations to prioritize candidates and to decide which ones to keep or drop.
When you use synthetic panel validation results, look at which decisions they can support as well as how similar they are. If your purpose or target differs from what the validation covered, you can identify what additional evidence you need. Knowing the criteria and scope of a validation lets you apply the results with confidence to the decisions you need to make.
Synthetic Consumer
AI


Opensurvey
Opensurvey is an AI research tech company. We connect the entire research process—from research planning to data collection and analysis—with AI, and we offer a platform, expert research services, and a consumer panel all together. We work alongside industry-leading companies such as Samsung Electronics, P&G, CJ CheilJedang, and Woowa Brothers, and over the past 14 years we have served some 3,000 corporate clients across 25,000 projects. With ISMS-P, ISO/IEC 27001·27701, and ISO 20252 certifications, along with full membership in ESOMAR, we meet international standards in both security and research quality.
Dataspace
Dataspace is an AI-powered consumer intelligence platform provided by Opensurvey. An orchestrator that understands research context, together with specialized agents for each stage, accompanies the entire research process—from planning to data collection, analysis, insight reporting, and sharing. Its Dual Layer architecture, which separates statistical computation from AI inference, ensures analytical accuracy, and every insight is presented with evidence grounded in real consumer responses. You can connect with consumer panels in 20 countries including Korea, collect data directly from your own customers, or use APIs to integrate with external platforms such as CRM systems. The consumer data and research context accumulated in Dataspace remain as a company's intelligence asset. Building on this, you can create synthetic consumers tailored to your own brand to hold conversations with them and predict market responses.
ⓒ Opensurvey
All copyrights to Opensurvey's content belong to Opensurvey Inc. When citing, you must always indicate the source; even with attribution, copying content in full, unauthorized reproduction, and redistribution are prohibited. When citing the source, please include the name of the Opensurvey blog and the URL or link of the article cited. ex) Opensurvey Blog, article URL or link